Back in 2006 Atlassian asked us to host the very first AUG (Atlassian User Group) in Europe. That gig turned into a 20-year habit of shuttling founders, engineers, and investors between Zurich and Silicon Valley—first with Beecom, now with Studio Alpha. Because friends know I live on that flight path, the same question pops up every trip:
“You’re in the States all the time—what’s really going on with Trump, Bessent, and these China tariffs?”
Even after tracking the headlines, I kept running into half-stories: plenty of numbers, but little about how the gears actually turn. So I mapped the whole machine for anyone who wants the full picture without an economics degree.
Loading...
What this deep-dive answers — quick table of contents
Who’s really “winning” on the scoreboards?
China-world, U.S.-world and the headline U.S.–China column side-by-side.
Why did Team Trump swing the tariff hammer in the first place?
Five flashpoints from WTO entry to today’s 10 % “cover charge.”
How can one iPhone inflate a $295 bn deficit?
Inside the WTO bookkeeping rule that counts shipping tags, not profits.
If the ledger is flawed, why do D.C. and Beijing still obsess over it?
Jobs are loud, savings are silent, and politics follows the noise.
What risks explode if that red number keeps climbing?
Dollar privilege, supply-chain leverage, and the tariff-war feedback loop.
Why does a 90-day Geneva pause matter—and what happens on day 91?
Full deal, muddle-through, or relapse? Impact on prices, cloud costs and sneakers.
Factory comeback + labour shortage = AI gold rush?
Why reshoring, tax cuts and full employment create tailwinds for automation-first startups.
Founder cheat-sheet
Five practical moves: buffer cloud COGS (Cost of goods sold), pitch the labour gap, map China exposure, dual-source, hedge FX.
Read on, and each question gets a plain-English answer.
1 | Trade War China VS. USA
Before deciding who’s “winning,” line up the three scoreboards—China-vs-world, U.S.-vs-world, and the headline U.S.–China column (the slice that drives headlines). Yes, it’s a flood of numbers, but that’s the only way the picture makes sense.
🇨🇳 China’s World Scoreboard: The Trillion-Dollar Surplus
No other country comes close. Germany’s famous surplus is barely a quarter of this, and the entire euro area doesn’t crack the trillion mark.1
🇺🇸 America’s World Scoreboard: The 1.2 Trillion Shortfall
Goods trade 2024:
Exports ≈ $2.09 trn
Imports ≈ $3.30 trn
Goods deficit ≈ –$1.21 trn ⛔️
Services trade 2024:
Exports ≈ $0.93 trn
Imports ≈ $0.51 trn
Services surplus≈ +$0.42 trn
Overall result: Goods deficit + services surplus = ≈ –$0.79 trn (still not good ⛔️)
The picture is partly offset by a $419 billion surplus in services - everything from cloud-software licences to Hollywood streaming rights - but the services surplus isn’t big enough to cancel the giant gap in merchandise.2
What the U.S. and China Buy from Each Other
Top U.S. imports from China (made in China 🇨🇳):
📱 Smartphones & other consumer electronics: $243 bn
🔧 Household machinery: $46 bn
🧸 Toys & sporting goods: $34 bn
🪑 Furniture & bedding: $31 bn
👟 Apparel & footwear: $21 bn
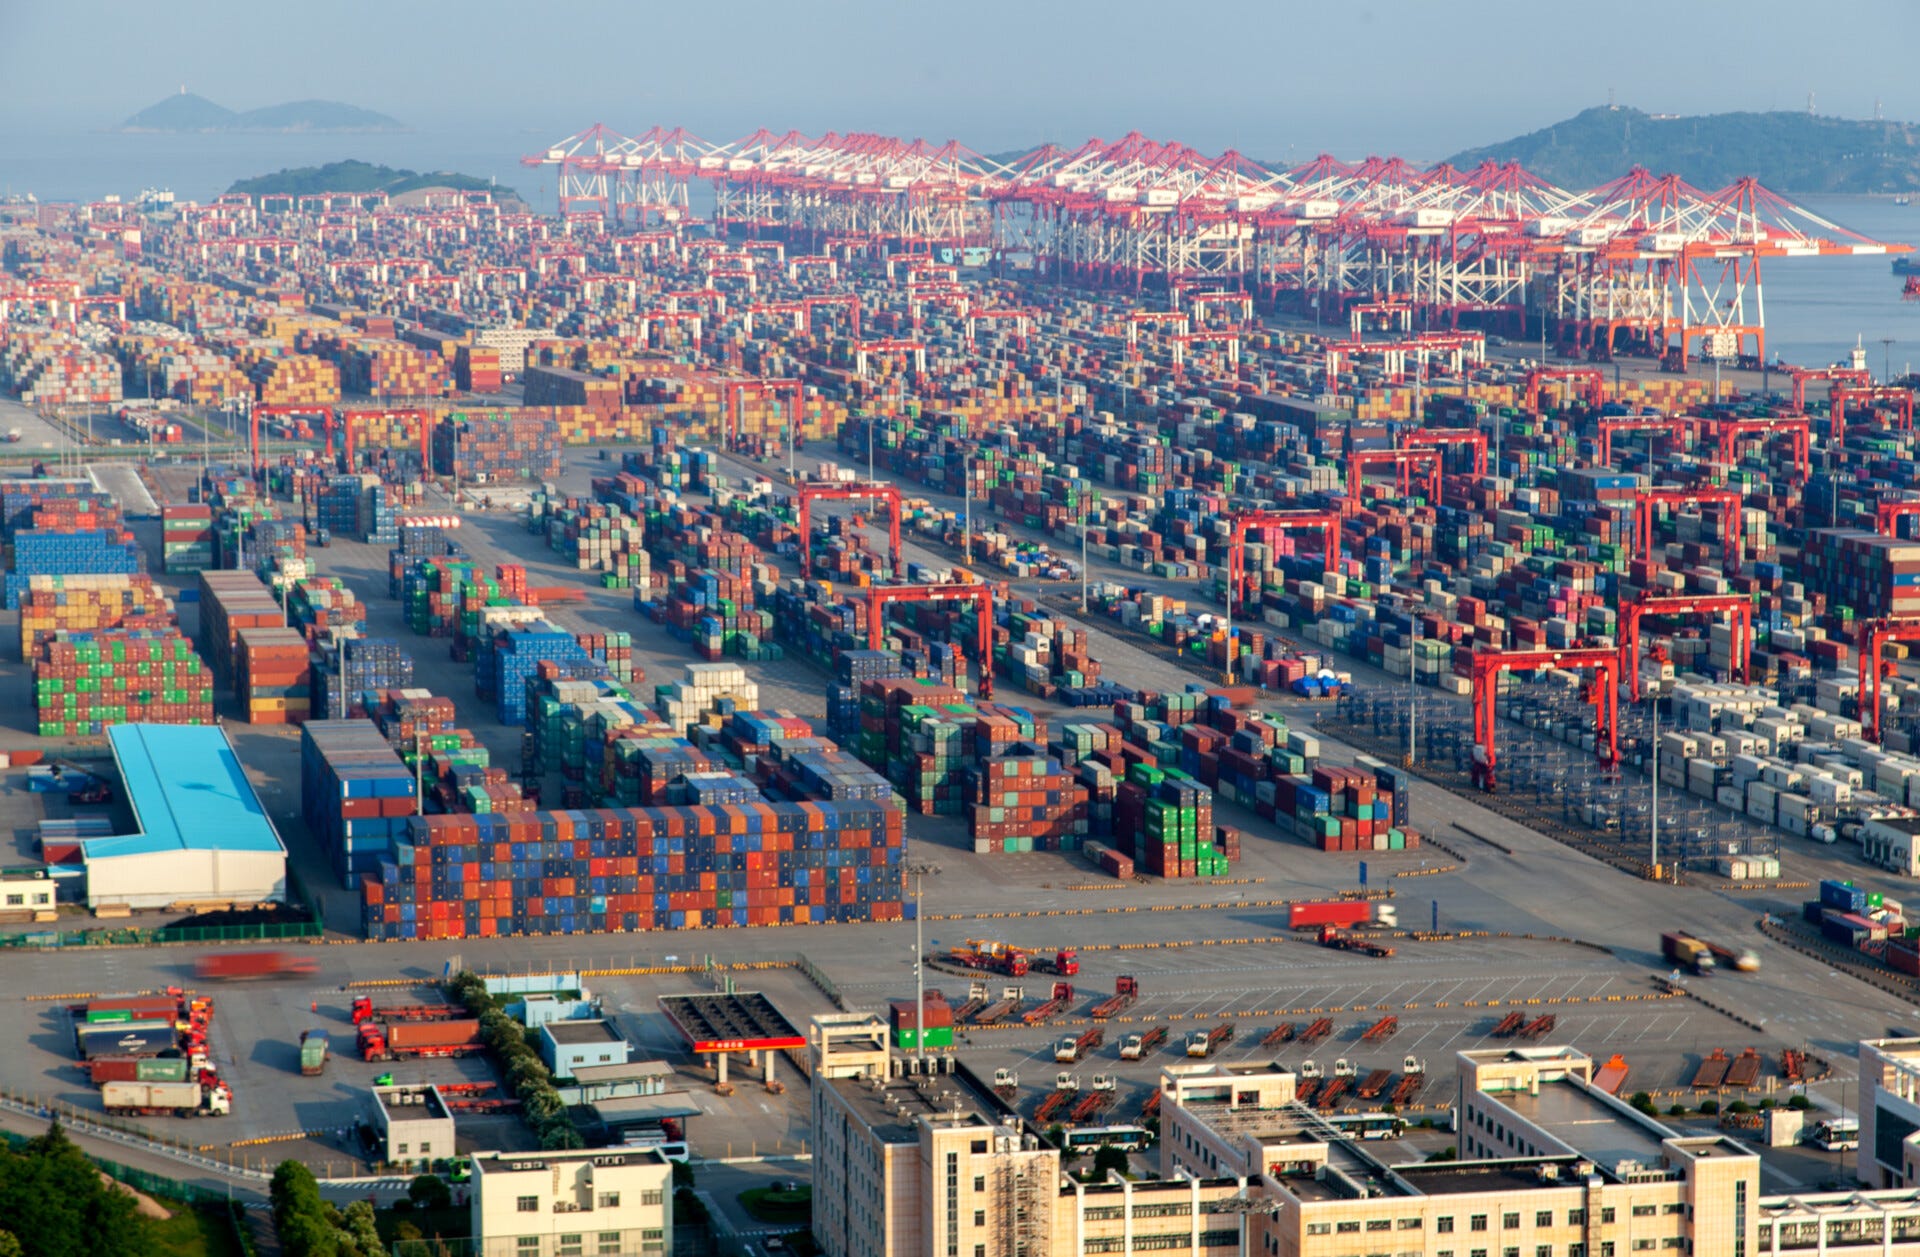
Pic. China, the world’s largest producer of smartphones, laptops, and game consoles.
Top Chinese imports from the U.S. (made in the USA 🇺🇸):
Pic. The United States - once more the world’s largest oil producer.
Bessent’s team points out that the U.S. goods deficit has blown out by roughly 40 % in five years—rising from about $860 billion in 2019 to a record $1.21 trillion in 2024. China accounts for the biggest slice of that shortfall: the bilateral gap sits near $295 billion, or roughly one-quarter of the entire U.S. goods deficit. As the chart below shows, the European Union ranks next at about –$236 billion. In other words, even if Washington and Beijing settle their score, another headline matchup—this time with Brussels—may be waiting in the wings. But first things first.3
Value of goods in 2024 by U.S. Trading Partners (in billions):
Pic. Value of goods in 2024 by U.S. trading partner, in billions (Source: WSJ)
Bottom-line contrast
Put the two world scoreboards side-by-side and the gulf is jaw-dropping: China finishes 2024 almost $1 trillion in the black on goods trade, while the United States ends $1.21 trillion in the red. Add those together and you get a 😳 $2.2 trillion swing—the same flow of smartphones, machinery and sneakers that props up China’s factories is the very flow that drags down America’s goods column. No wonder the headline gap between the two countries hogs the spotlight: it sits on top of an already staggering global mismatch.
2 | Why Team Trump Reached for Tariffs
China’s surplus is giant, America’s deficit is glaring, and the Beijing column is the reddest of all. So what?
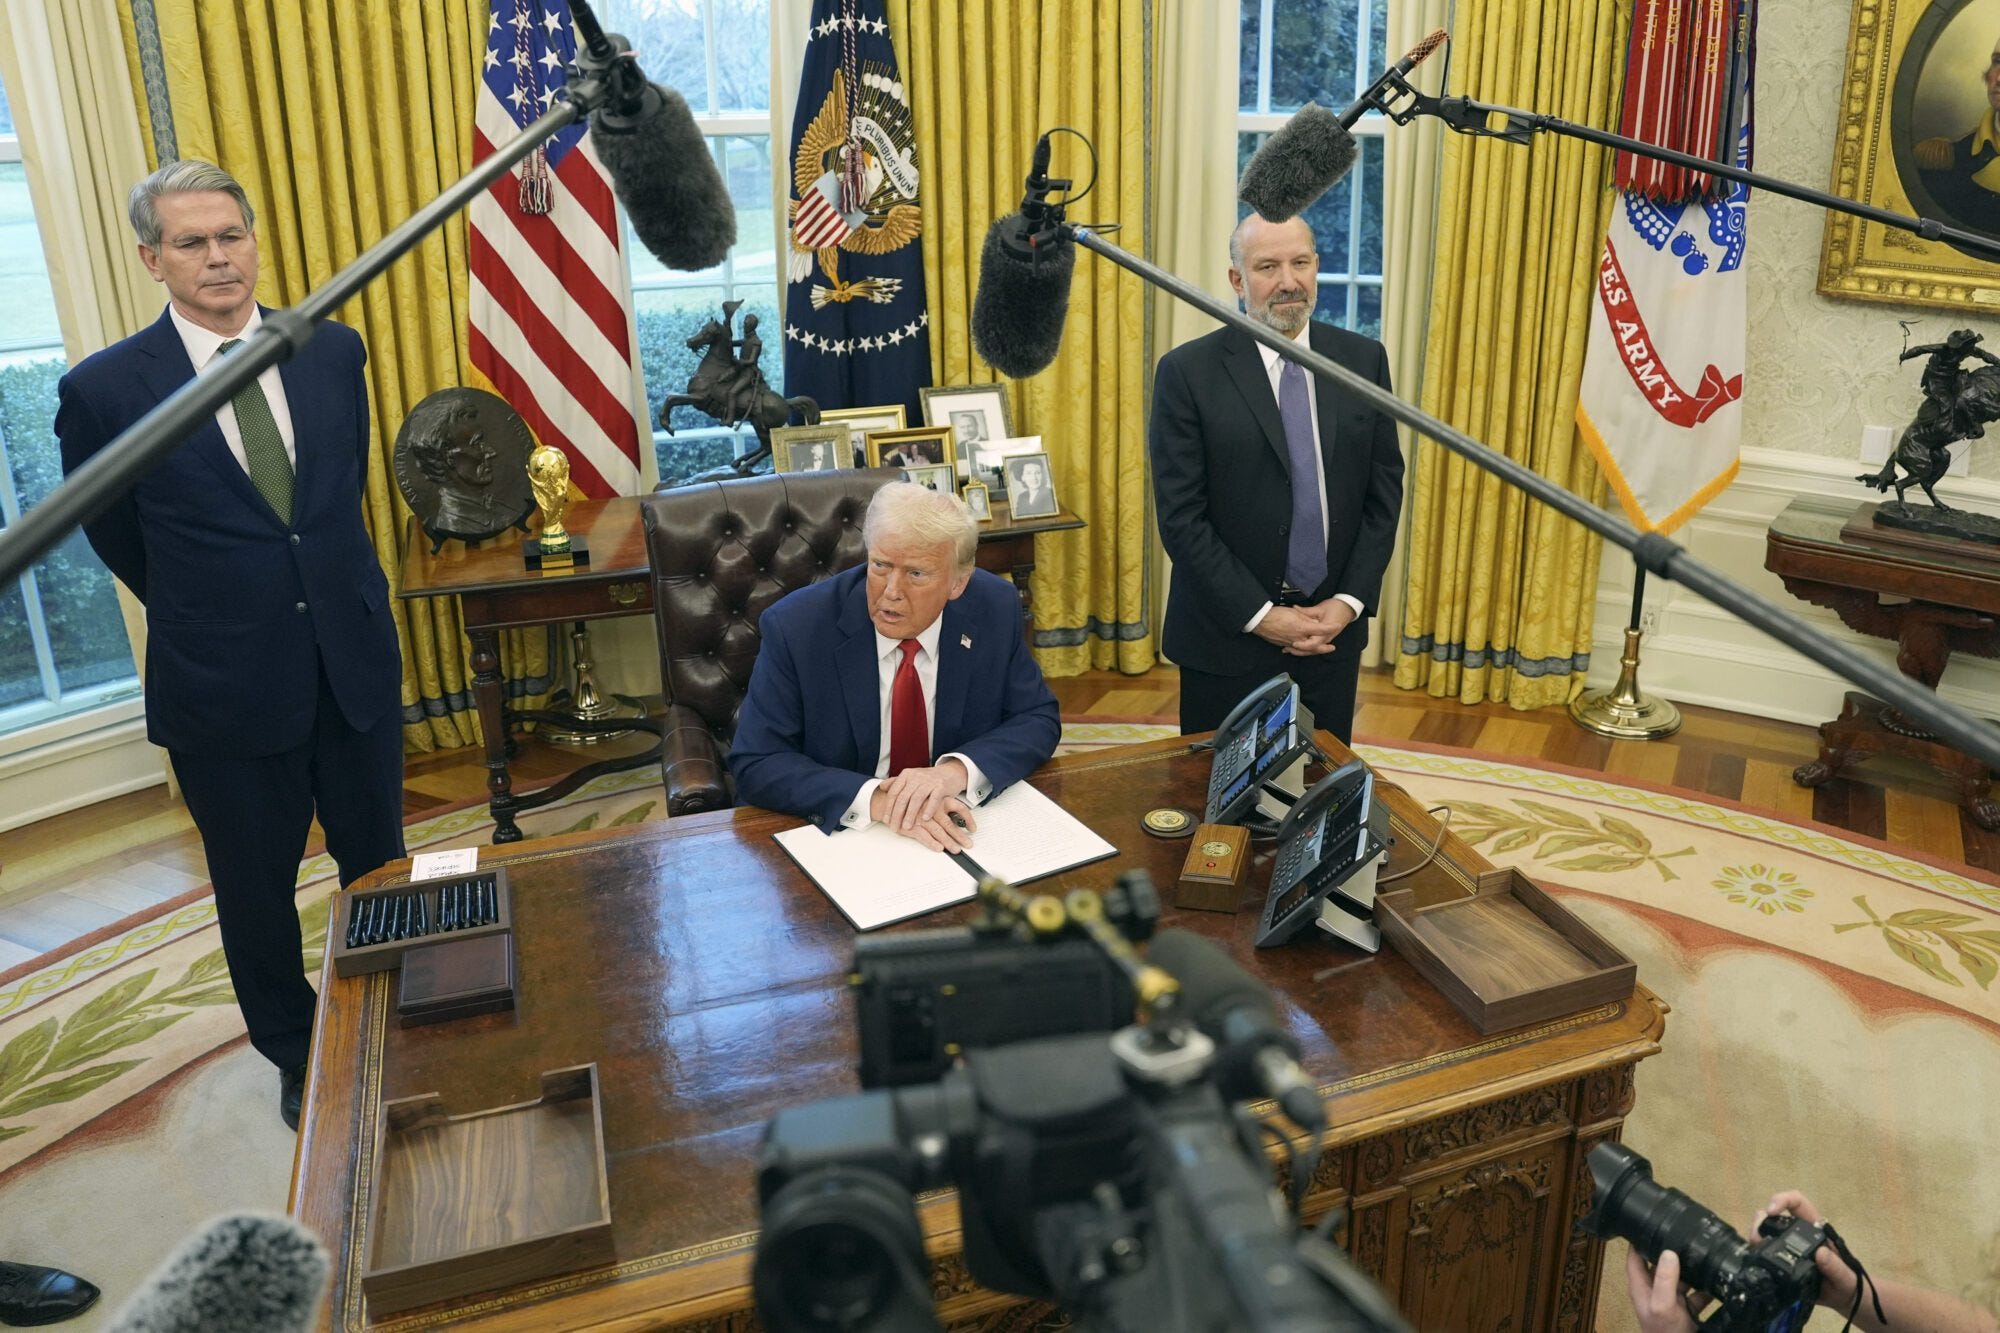
Pic. Team Trump: Treasury Secretary Scott Bessent, left, and Commerce Secretary nominee Howard Lutnick, right
This chapter rewinds the tape. We’ll walk through five key moments—starting with the Kentucky TV plant that couldn’t beat Shenzhen prices—then map the three grievances Bessent hammers home on Main Street, and finally show what the White House thinks tariffs can actually fix. By the end you’ll see why a universal 10 % “cover charge” became Washington’s Swiss-Army knife for everything from factory layoffs to fentanyl precursors.
Five checkpoints on the road to a tariff war
2001 | China joins the WTO — the Kentucky-TV moment
Overnight a big-box chain like Walmart can order a container of flat-screen TVs from Shenzhen at a price no factory in Paducah, Kentucky, can match. America’s goods gap with China leaps from $83 bn to $266 bn in seven years.4
Take-home: Prices drop for shoppers; a small U.S. plant shutters. Local news calls it “China shock.”
2010-2016 | “Made in China 2025” — Beijing’s moon-shot checklist
China’s government tells banks: “Lend cheap to any company building chips, EV batteries, or industrial robots.” Those sectors start scaling at break-even prices U.S. startups can’t touch.5
August 2017 | Section 301 investigation — forced code swap
U.S. firms report they must hand over source code or form 51 % Chinese joint ventures to sell in the mainland. Under U.S. law Section 301 lets the president retaliate if a partner’s rules look “unreasonable”.6
2018-2019 | Tariff round one — washers, steel, then everything
Washington hits $370 bn of Chinese goods with 25 % duties; Beijing fires back on $110 bn of American exports, including soybeans and bourbon. Prices of washing machines jump $85 overnight in Home Depot; Iowa farmers watch soybean orders vanish.
April 2 2025 | The “baseline 10 %” shock
President Trump imposes a universal 10 % tariff on every import and a country surcharge tied to each nation’s surplus. China lands at +34 %. Both sides over-react to a combined 125 % before last week’s 90-day Geneva truce.
Pic. Tit-for-tat moves between U.S. and China (source: The New York Times)
So although China slashed duties compared with its pre-WTO era, it still retains far more policy space than mature economies. That gap—legal under the WTO’s developing-country carve-outs—is what Washington now calls “non-reciprocal.”7
Team Trumps three big grievances (and why they resonate on Main Street)
Jobs & wages: Your uncle’s TV-assembly line in Kentucky shuts down and the work moves to Guangdong. Roughly 3.4 million U.S. manufacturing jobs lost since China joined the WTO in 2001, most in mid-skill assembly roles.8
Uneven playing field: A U.S. startup pays about 2.3 % duty to import test gear into Ohio, while the same gear shipped into China faces a 7.4 % tariff plus a months-long safety-licence wait. That’s just one example how China makes it harder for foreign companies to be active in China.9
Security supply lines:
Antibiotics: Roughly 80 % of the active ingredients for U.S. prescription antibiotics are made in China; one export curb could empty hospital pharmacies in a month.
Rare-earth magnets: China controls about 90 % of global output of neodymium and other rare-earths used e.g. in EV motors, wind turbines and F-35 jets. A new export-licence regime rolled out in April is already slowing shipments; industry groups warn European production could stall within weeks.10 The Commerce Department flags rare-earth magnets high-risk dependencies.11
Pic. U.S. F-35 fighter — a $100 m jet that still relies on Chinese rare-earth magnets to get off the ground.
.
Bonus risk: Fentanyl precursors: U.S. drug-enforcement labs trace most of the chemicals that end up in illicit fentanyl back to a small cluster of Chinese suppliers—one shipment delay (or blind eye) can move the overdose needle nationwide.
Why the $295 bn China gap sets off the sirens
It’s the single largest slice of America’s $1.21 trn goods deficit—about one in every four red dollars.
Easy political math: “Every $1 bn in Chinese surplus = about 6 000 American factory jobs.”
Quick optical win: if Beijing bulk-buys soybeans or lets U.S. cloud firms sell seats in Shanghai, the headline gap shrinks fastest.
What tariffs are supposed to do (according to the White House)
Re-shore “strategic” industries — make imports pricier so U.S. chip and steel plants revive.
Force reciprocity — or: make selling into the United States just as painful as selling into China is today; pain at China’s port gate pushes Beijing to drop its own tariffs and licence delays. (see footnote explanation for more details12)
Bag purchase deals — huge orders of U.S. LNG (liquefied gas), soybeans, and Boeing jets yank the goods gap lower fast.
Send a signal to allies — “All goods pay a 10 % entry fee—unless your country opens its market as much as we do.” - Equal pressure on everyone is important. Because by applying a single “cover charge” to all imports, Washington avoids WTO claims of discrimination. Allies know exactly what the U.S. wants: match America’s average MFN (Most-Favoured-Nation; rate (≈ 2 %) and keep non-tariff delays minimal.
How an ally can earn a carve-out:
Lower its own border taxes. Example: the U.K. offered zero-duty access on U.S. beef and whiskey in early 2025.
Scrap hidden walls. Faster product-safety licences, no data-localisation for cloud providers (think EU), no forced joint ventures.
Prove no currency games or heavy industrial subsidies.
If a partner meets those tests, the U.S. can—by executive proclamation or bilateral deal—exempt that country’s shipments from the 10 % tariff (or refund it after entry).
“The U.K. and Switzerland skipped to the front of the queue because they came with real offers—lower tariffs, no currency manipulation, and fewer non-tariff barriers.”
Pic. U.S Trade Representative Jamieson Greer, U.S Secretary of the Treasury Scott Bessent, Switzerland's President Karin Keller-Sutter, Swiss Federal Councillor Guy Parmelin pose during a bilateral meeting between Switzerland and the United States, in Geneva, Switzerland, May 9, 2025
What happens to laggards: Economies that keep higher tariffs (the EU still averages ~5 %) or thick red tape (safety licences, data-localization mandate, forced tech transfer) keep paying the 10 % at the U.S. border—plus any sector-specific duties already in place. Pain becomes the negotiating lever.
The strategic play:
Incentive alignment: allies are nudged to open their markets voluntarily rather than be singled out later.
Negotiating leverage with China: if Europe, Japan, and the U.K. all strike carve-outs, Beijing feels isolated under the fee—and has more reason to bargain.14
3 | How the customs scoreboard is built
Pic. iPhone production in China
Remember: the “China vs. USA” score you see isn’t a special rule cooked up for that rivalry. The World Trade Organization (WTO) sets one bookkeeping system for every country on Earth: whatever value is printed on the box when it crosses the border goes into the import-export columns.15 Japan, Germany, Mexico, the U.S.—all play by that same shipping-tag rule.
A phone’s border price
An iPhone leaves Foxconn’s factory in Shenzhen with a shipping tag that says $450.16 That figure includes every foreign part inside plus Chinese assembly wages.
Customs writes it down, once
U.S. Customs and Border Protection adds $450 to the “imports from China” column and never revisits that number.17
Retail profit lives elsewhere
A week later Apple sells the phone in Dallas for $1 000. The extra $550 shows up in U.S. retail-sales data and Apple’s profit report—not in the trade ledger. The import number is already frozen.18
Multiply that shipping-tag routine by millions of phones, laptops, toys and tools, and you get the famous $295 billion goods deficit. The ledger says “we bought more from China than they bought from us,” even though much of the profit on those products flows back to Cupertino, Tokyo, Seoul—or your index-fund account (most 401(k)19 index funds mirror the S&P 500, where Apple is about 7–8 % of the entire basket, so its profit bumps your returns too)
Where the money really lands
Roughly $50 of that $450 stays in China as labor pay and local parts.20
About $150 covers screens, camera modules and chips from Korea and Japan (and that $150 is logged as China’s imports from Korea and Japan, showing up in their bilateral ledgers—not in the U.S.–China one)21
The remaining $250 – $300 is Apple’s margin, design fees and patent income—booked in the U.S. (or Ireland, or Singapore) and eventually paid out to shareholders, pension funds and 401(k)s.22
Bottom line: the trade ledger counts the entire $450 transfer price as a “Chinese export,” even though barely $50 stays in China and more than half flows back to Apple and its suppliers in the U.S. and allies. The extra $550 that Apple earns when the phone sells for $1 000 in Austin is pure domestic profit—money that boosts U.S. GDP and shareholders—but never shows up in the trade books at all. So the WTO ledger is accurate but one-dimensional. Policymakers still obsess over it because it’s the only number the whole world agrees on—and the one voters see in headlines—yet it can paint a misleading picture of who truly gains from trade.
Concentrated pain, diffused gain — why “we’re losing” feels true
Factory closings are loud. One announcement wipes out a town’s tax base and tops the local news for weeks.23
Consumer savings are silent. Cheaper phones, TVs and clothes put $350–$850 a year back into the average U.S. household, but no one throws a parade for prices that didn’t go up.24
Tech profits are invisible locally. Apple’s record quarter helps 120 million 401(k) accounts by a few dollars each; no single neigborhood feels it.25
So the costs scream and the benefits whisper. Politically, the scream wins.
4 | Why the deficit still matters in Washington
Pic. Demonstration in Washington
Even when the scoreboard misleads, it drives real-world decisions—because the pain is concentrated and the gain is spread thin.
Jobs are local and loud. From 2000 to 2010 the U.S. shed about 5 million manufacturing jobs, mostly mid-skill assembly roles. When a single Ohio plant closes, the front page and the town’s tax base feel it the same day.26
New work hides in different zip codes. Over roughly the same stretch the economy added ≈ 12 million professional and tech jobs—but they popped up in Austin or Seattle, not in the towns that lost machine shops.27
Savings are national and quiet. Fed/NYU studies show Chinese imports cut consumer prices enough to save the average U.S. household $350–$850 every year, but no family gets a letter saying “Congrats, tariffs just saved you a new iPad.”28
Tariffs are blunt but visible. A 30 % duty lands overnight and lets Washington say, “See, we acted”—even though it also raises prices for the very factory worker who just lost a job.29
China is on the label. Customs paperwork says “Made in China,” so the only place Scott Bessent can push to shrink the red number is Beijing—no matter how much of each iPhone’s profit flows back to Cupertino.
That’s why the Treasury secretary isn’t banging on Apple’s door to repatriate margin; he’s bargaining with the government named on every shipping tag, trying to move the only number voters and headline writers see.
5 | Why Bessent fights a number he knows is flawed—and why it still matters
Pic. George Soros — Scott Bessent (not pictured) ran Soros’s $30 billion family office as Chief Investment Officer from 2011 to late 2015, before striking out on his own and becoming a billionaire in his own right.
Scott Bessent built his legend as a macro trader, so he’s not fooled by the trade ledger’s quirks; he knows a “Chinese” iPhone funnels plenty of profit back to Cupertino. Yet the goods-deficit figure is the only score that simultaneously
sways voters,
moves Congress to act, and
sets the legal footing for any WTO-style deal.
If that red number keeps climbing, pressure for 50 % tariffs or outright quotas becomes irresistible. Worse, an ever-wider gap carries three hard risks:
Dollar privilege can erode. Surplus dollars now recycle into U.S. Treasuries; if partners tire of funding a bottomless deficit, they can shift savings to euros or gold, nudging U.S. interest rates higher for mortgages, student loans, and federal debt.30
Supply-chain leverage tilts abroad. The larger the gap, the more the U.S. depends on overseas factories for critical stuff—battery cells, drug ingredients, advanced chips. One diplomatic spat or port shutdown can flip from nuisance to crisis overnight.31
Domestic blowback hardens. Every fresh plant closure feeds the “we’re losing” narrative, pushing Congress toward bigger trade walls that raise consumer prices and invite retaliation—risking a full-blown trade war.
So Bessent’s mission is two-layered: cool the optics by nudging the headline deficit down, and quietly cut real exposure—diversify supply chains, secure key inputs—before the next shock hits. He’s playing on the only scoreboard all governments recognize; imperfect or not, it’s the board that decides the game.
BTW: Why Chinese families stash cash instead of spending it
Pic. Shopping in NYC not= Shopping in Bejing
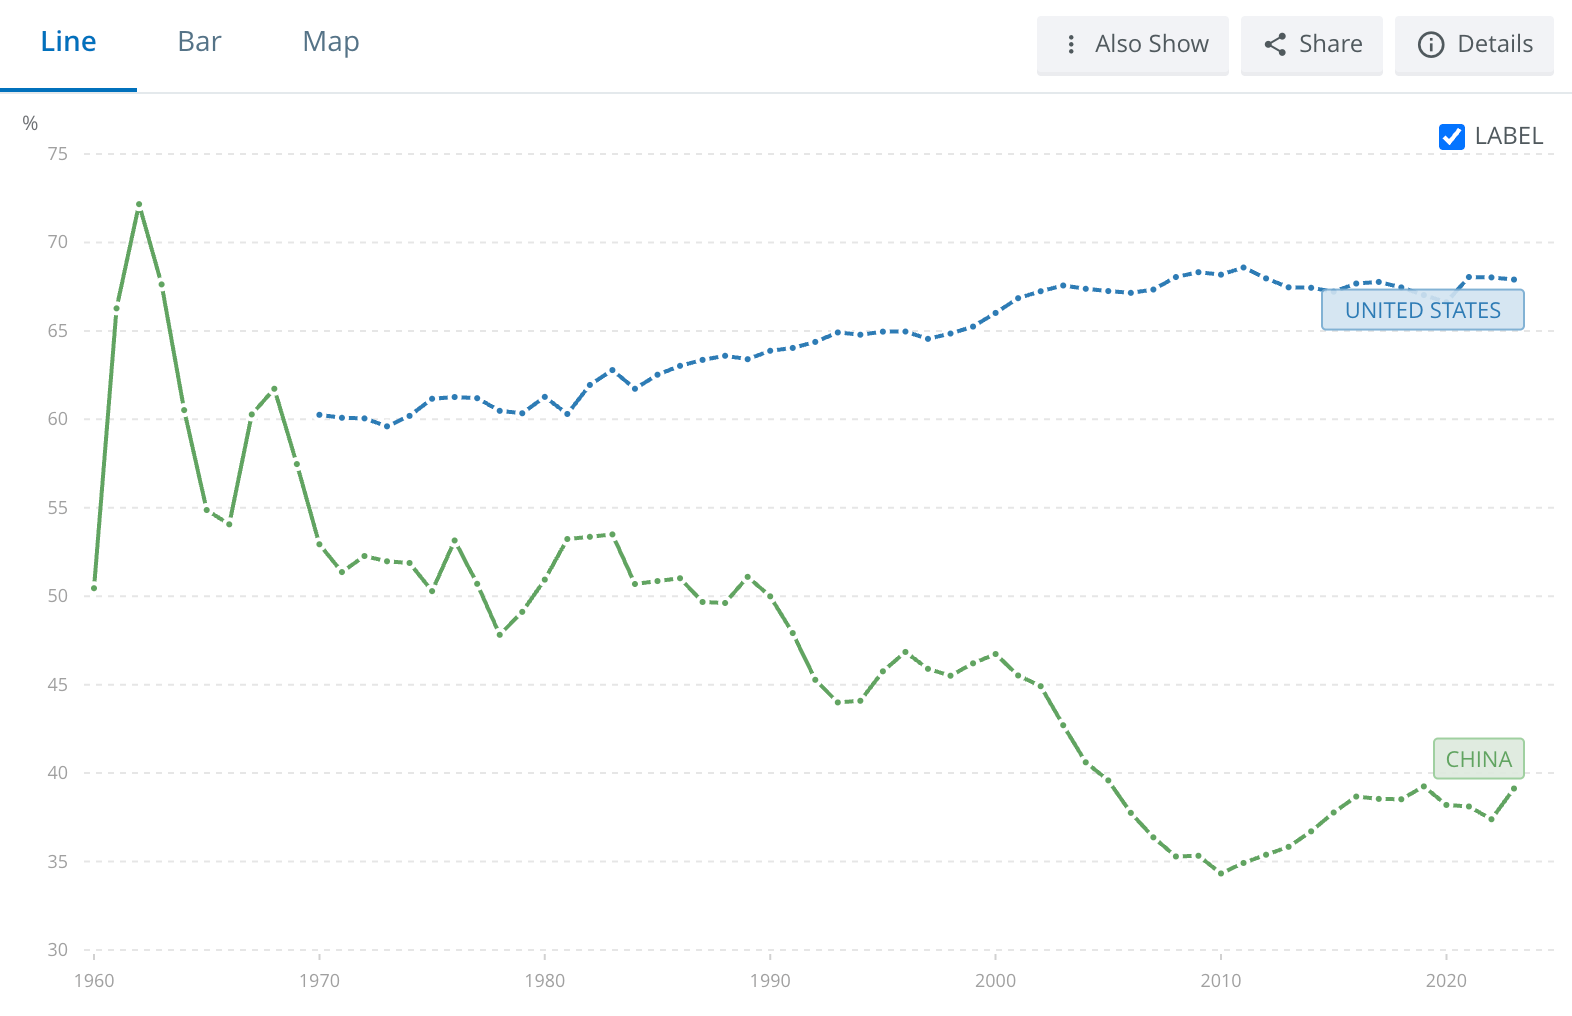
China’s safety nets are wafer-thin: public health cover is patchy, state pensions are modest, and a single university seat or urban apartment can swallow decades of savings. So households hoard money as an iron reserve—household saving hovers around 40 % of GDP. When consumers keep their wallets shut, factories can’t sell everything at home; they overproduce and push the excess abroad, creating the huge export surplus that shows up in America’s trade-deficit column. Flip the picture and you see the contrast: U.S. consumers drive roughly 70 % of U.S. GDP, Chinese consumers only about 40 %. China’s “under-consumption” is the mirror image of America’s goods deficit—and a big reason Bessent’s scoreboard keeps flashing red.
Graph: Households and NPISHs final consumption expenditure (% of GDP) - United States, China 32
6 | Geneva’s 90-day pause — leverage, not solution
Pic. US ambassador’s residence in Geneva
In Geneva both sides agreed to slash tariffs—from 145 % to 30 % on most Chinese goods and from 125 % to 10 % on U.S. goods—but only for a 90-day trial window.
After digging into the numbers for this post, I’m struck by how tangled the real issues are; ninety days is barely a coffee break in trade-deal time, yet that’s all the breathing room negotiators have to turn a headline truce into something lasting.
What could happen next?
🟢 Full deal
China bulk-buys U.S. farm goods and semiconductors
Washington shelves new sector tariffs
Result: Nikes drop $15, volatility cools
🟡 Muddle-through
Talks show “some progress,” deadlines slide in 30-day chunks
Result: analysts trim 2025 outlook
Result: Cloud costs +4%
🔴 Relapse
Talks implode; both sides snap back to 125 %–plus duties
Result: importers rush shipments, prices jump before the holidays, risk-off hits markets
Result: holiday toys +8%
My bet: we float between 🟡 and 🔴. Politically, 10 % feels like the new tariff floor; the near-zero world of 2015 isn’t coming back soon.
7 | ⚙️ “Factory Meet Bot” — why a reshoring-plus-tax-cuts agenda is (mostly) bullish for founders
Pic. Robots … made in China
If the White House really yanks production lines back onshore and shaves taxes and red tape, two big forces converge in a way software teams can love:
Demand pops, budgets loosen. New plants need ERPs, payroll, MES dashboards, and security tools. Lower headline tax rates mean more cash stays inside those firms—cash that can pay SaaS invoices instead of the IRS.
Labour is already tapped out. The U.S. jobless rate has sat in a tight 4.0 – 4.2 % band for a full year.33 Add thousands of factory roles and the hiring pool snaps. Managers will reach for automation—gen-AI copilots, workflow agents, warehouse robots—because humans are booked.
McKinsey pegs the productivity upside of generative AI at 0.1–0.6 ppt of extra GDP growth a year, or $2–$4 trillion in value, through 2040.34 In plain English: every percentage point the labour market tightens makes “buy the bot” look cheaper.
Founder checklist :
Lead with the labour gap. Investors grasp it in one line: “Full employment + reshoring = automation tailwind.”
Price on head-count ROI. If your AI tool replaces a $75 k salary, a $25k/y subscription is an easy sell.
Pad cloud COGS (Cost of Goods Sold). A tariff snap-back could lift U.S. region prices 3-4 %. Keep that buffer in your model.
Stay dollar-denominated but hedge. A tight labour market props up USD—until sentiment flips and overseas contractor costs spike. Talk to your banker about a basic FX plan.
Watch the China door. If Beijing cracks open step-by-step, be ready with compliance homework so you’re first in.
Ignore week-to-week market noise. Your startup’s horizon is 5-10 years; daily stock swings aren’t your KPI.
Bottom line: factories returning home won’t steal the software spotlight—they’ll shine it brighter. With talent scarce, the next growth spurt belongs to startups that sell efficiency, autonomy, and AI muscle.
BTW: Why can China keep higher border taxes than the U.S. or Switzerland and still be WTO-legal? - When Beijing joined the WTO in 2001 it was allowed to sign up as a “developing country.” Under WTO rules that status—known as special and differential treatment—lets a member:
Bind tariffs at higher ceilings. China’s average “bound” rate on goods is 9–10 %, versus 5 % or less for high-income members.
Phase changes in slowly. Beijing got transition periods of up to 15 years to roll back quotas and open some service sectors.
Limit service-sector access. Joint-venture rules and licence caps on cloud, finance, and entertainment sit outside strict goods-tariff disciplines.
So although China slashed duties compared with its pre-WTO era, it still retains far more policy space than mature economies. That gap—legal under the WTO’s developing-country carve-outs—is what Washington now calls “non-reciprocal.”
Washington’s logic is blunt: make selling into the United States just as painful as selling into China is today.
Here’s the chain reaction they hope for:
Raise the U.S. gate fee.
A universal 10 % baseline tariff plus a China kicker (once 34 %, now paused at 10 %) lifts landed costs for every Chinese exporter—from TV makers in Shenzhen to auto-parts suppliers in Ningbo.
Exporters feel the squeeze first.
Those firms suddenly lose margin or market share in their biggest foreign market. They complain—not to Washington, but to Beijing’s Ministry of Commerce.
Beijing faces home-grown pressure.
To keep factories humming and jobs intact, Chinese officials need relief. The quickest give-back: cut their own tariffs and slash the red-tape delays (the 4- to 6-month safety licences, the forced joint-venture rules, the data-localisation demands).
Concessions feed straight into the headline deficit.
If China halves its 15–30 % duties on U.S. farm goods and LNG—or issues 30-day cloud licences instead of 6-month ones—U.S. exports jump, the $295 bn gap shrinks, and the White House can claim the tariffs “worked.”
Think of it as a price-matching game: “We’ll keep charging your exporters 10 % (or more) until you charge ours closer to 2 % and stop slow-rolling their paperwork.”
It’s leverage, not ideology—the pain at America’s port gate is intended to boomerang back through China’s own business lobby and push Beijing to narrow the policy gap.
Sources: USTR Section 301 Report (2018) for non-tariff barrier list; WTO Tariff Profiles 2024 for average MFN rates; Peterson Institute Brief “Will tariffs make China blink?” July 2024 for exporter-lobby mechanics.
A 401(k) is a U-S workplace retirement plan that lets employees invest part of each paycheck tax-deferred. Most people fill that account with index funds—low-cost mutual funds or ETFs that simply copy major stock benchmarks like the S&P 500. 401(k) index fund means: the chunk of your retirement savings that automatically buys every S&P 500 stock in proportion to its size—about 7–8 % of which is Apple right now. Basically relevant for every US citizen.
U.S. Bureau of Labor Statistics (BLS) Current Employment Statistics series, which shows manufacturing payrolls falling from roughly 17.3 million in January 2000 to 11.5 million in January 2010—a loss of about 5.8 million jobs (the bulk in mid-skill assembly).
Source: U.S. Bureau of Labor Statistics, “All Employees: Manufacturing (CES3000000001),” Current Employment Statistics. https://www.bls.gov/ces/