🌪️ The Perfect Storm PART II
Understand Investments in Financial Markets Through Effective Data Analysis
Welcome to Roll-Right-In/Money, brought to you by Tim, Max, and Fabian from Oceanic.us Partners and StudioAlpha.capital. We're here to keep you informed on the latest financial market updates and their implications for founders and investors. In this week's blog, we explore the tense macroeconomic situation impacting companies, startups, investors, and soon, consumers part II (read part I)
This blog is a 5-min read.
What happened in part I? - In simple terms, the current economic crisis is a result of high inflation, a struggling banking sector, emergency laws, regulations in the crypto space, and potential recession. These issues are partly due to too much money being printed, the pandemic, and rapidly changing interest rates.
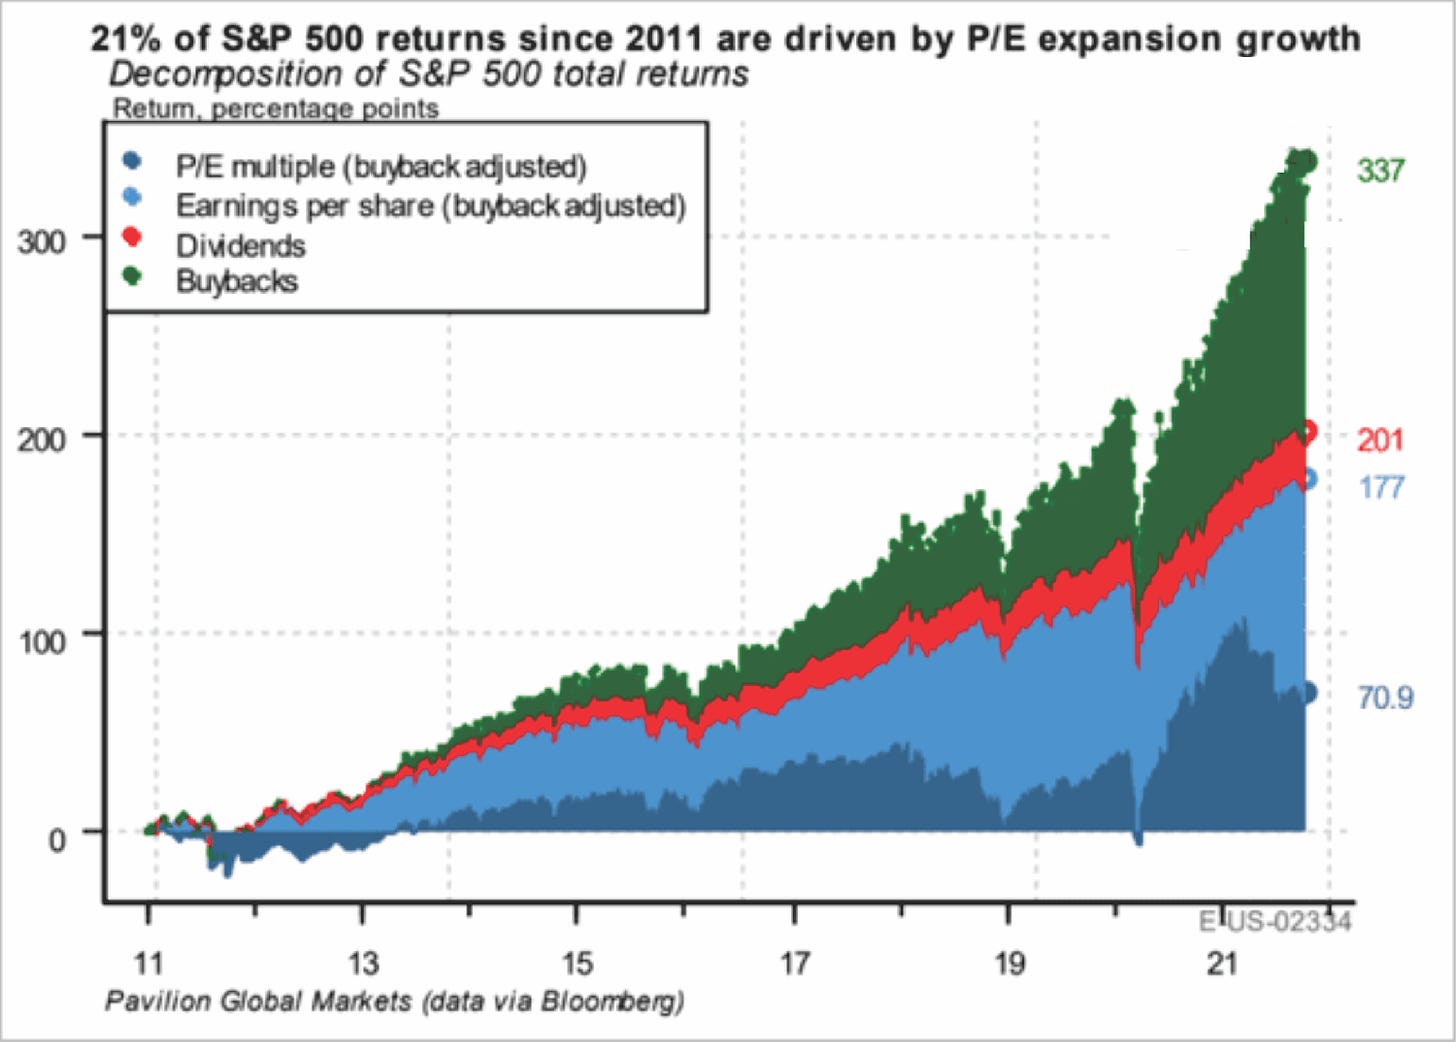
In the past, we've seen long-term trends, like the debt cycle and falling interest rates, shape the economy. The 2008 financial crisis and COVID-19 pandemic led to major policy changes to stabilize markets, resulting in more money being lent to investors and businesses. This has fueled stock market growth, mainly through higher company valuations and increased stock buybacks. However, this growth is not entirely due to actual business performance, which has led to a global reset in how companies are valued.
Pic: 21% of S&P 500 returns since 2011 are driven by P/E expansion growth (Data: Bloomberg)
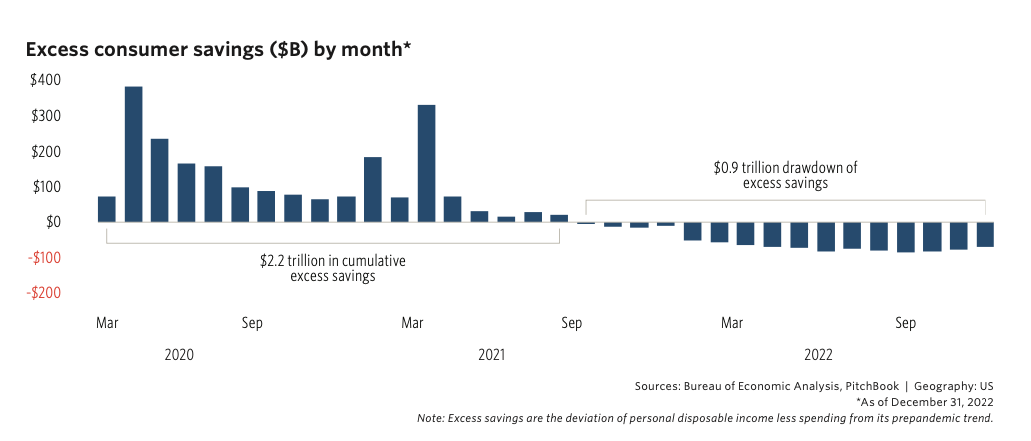
Why it matters: During the pandemic, a few key factors led to rising inflation. One major factor was the massive financial support provided by the government, which resulted in $2.2 trillion 😳 in extra savings for consumers. This extra money quickly made its way into the economy and is still being spent. The government provided three rounds of COVID aid, with some of that money finding its way into the stock market and causing a frenzy of speculation
Pic: Excess consumer savings by month (Data: PitchBook)
Pic: Ad powered by StudioAlpha
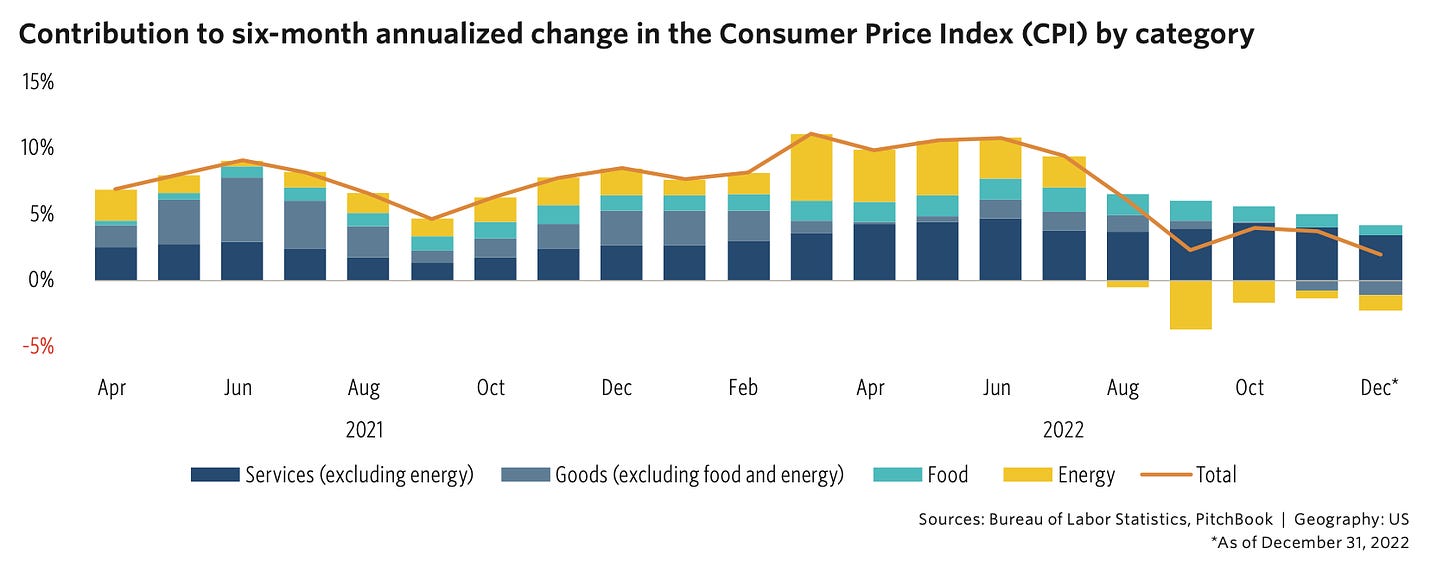
The lockdowns: During the pandemic the lockdowns 🥱 caused a unique situation where goods production slowed down, but people received stimulus money. This led to more money chasing fewer goods, causing prices to rise. At first, it was thought that this inflation was temporary and mainly due to supply chain disruptions. However, as the conflict in Ukraine/Russia sparked energy inflation, and economies reopened, inflation spread from goods to services.
People started using services more as they had been putting off their consumption during the pandemic. Housing costs played a significant role in driving up service-related inflation. Factors like low interest rates, limited housing inventory, and people moving away from cities caused housing prices and rent to skyrocket during the pandemic.
Pic: Contribution to six-month annualized change in the CPI by category (Data: PitchBook)
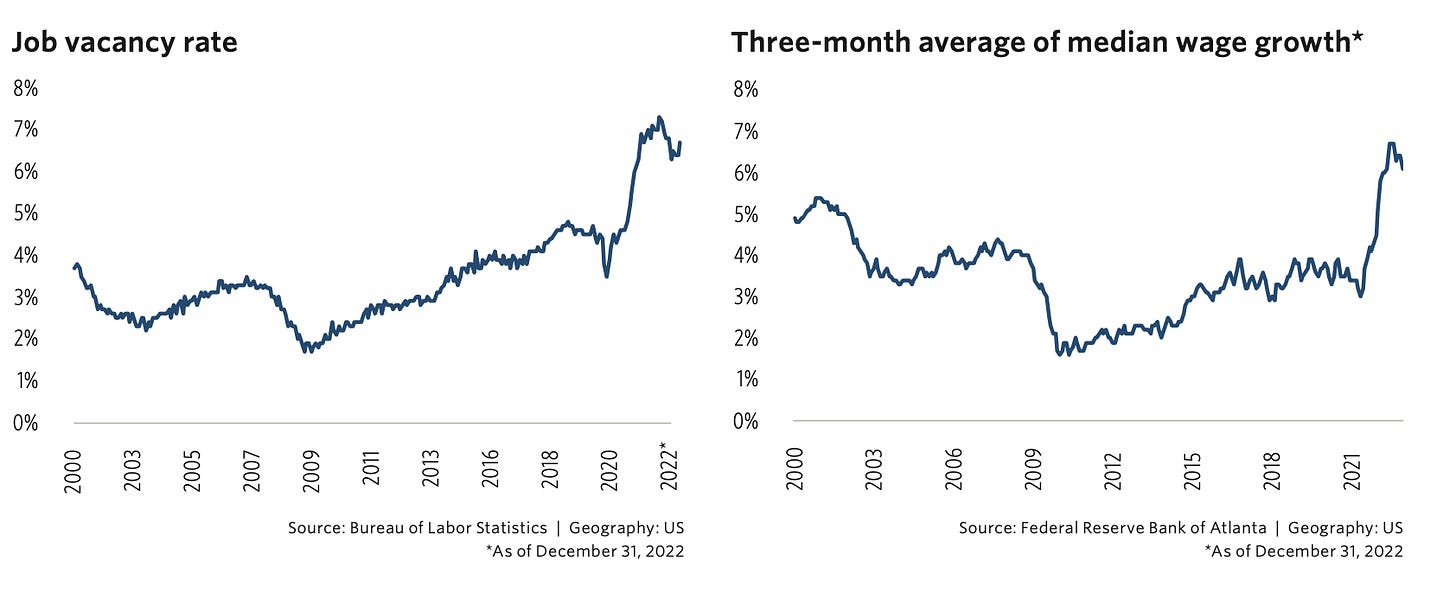
Wage price spiral: During the pandemic, there was an increase in wage inflation and a shortage of workers. This increase in wages happened because there were fewer available workers in the US labor market, a trend that has been ongoing for some time. The pandemic made this situation even worse, with around 3 million fewer workers in the US labor force compared to before the pandemic.
Higher wages and worker shortages can make inflation last longer, which is something the Federal Reserve wants to avoid. One way the Fed can address this issue is by trying to improve the labor market, which is what they are attempting to do now.
Pic: Job vacancy rate & three-month average of median wage growth (Data: Federal Reserve Bank of Atlanta)
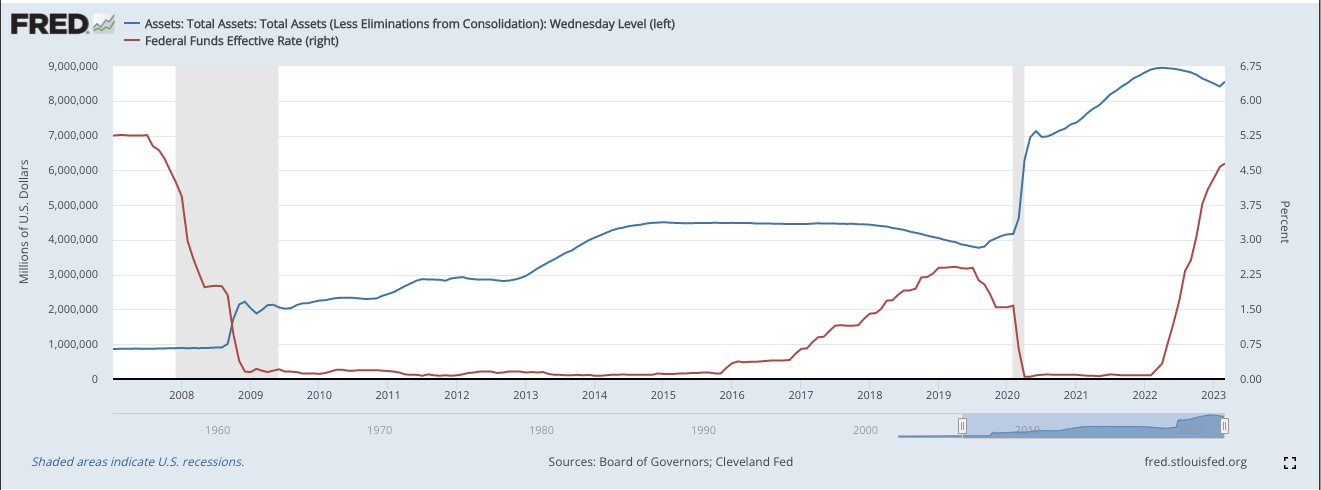
Flood of money: Due to all these challenges, the Federal Reserve and central banks around the world had to quickly change their approach, which had supported the markets during COVID and since the financial crisis. This can be seen in the rapid increase in the key interest rate and a slow reduction in the central banks' balance sheets.
As the interest rate increased, bond prices fell and yields went up. Even though company earnings weren't greatly affected at that point, the stock markets started to struggle because of these changes.
Pic 1: the brief history of interest rates and monetary policy since the financial crisis (Data: fred.stlouisfed.org)
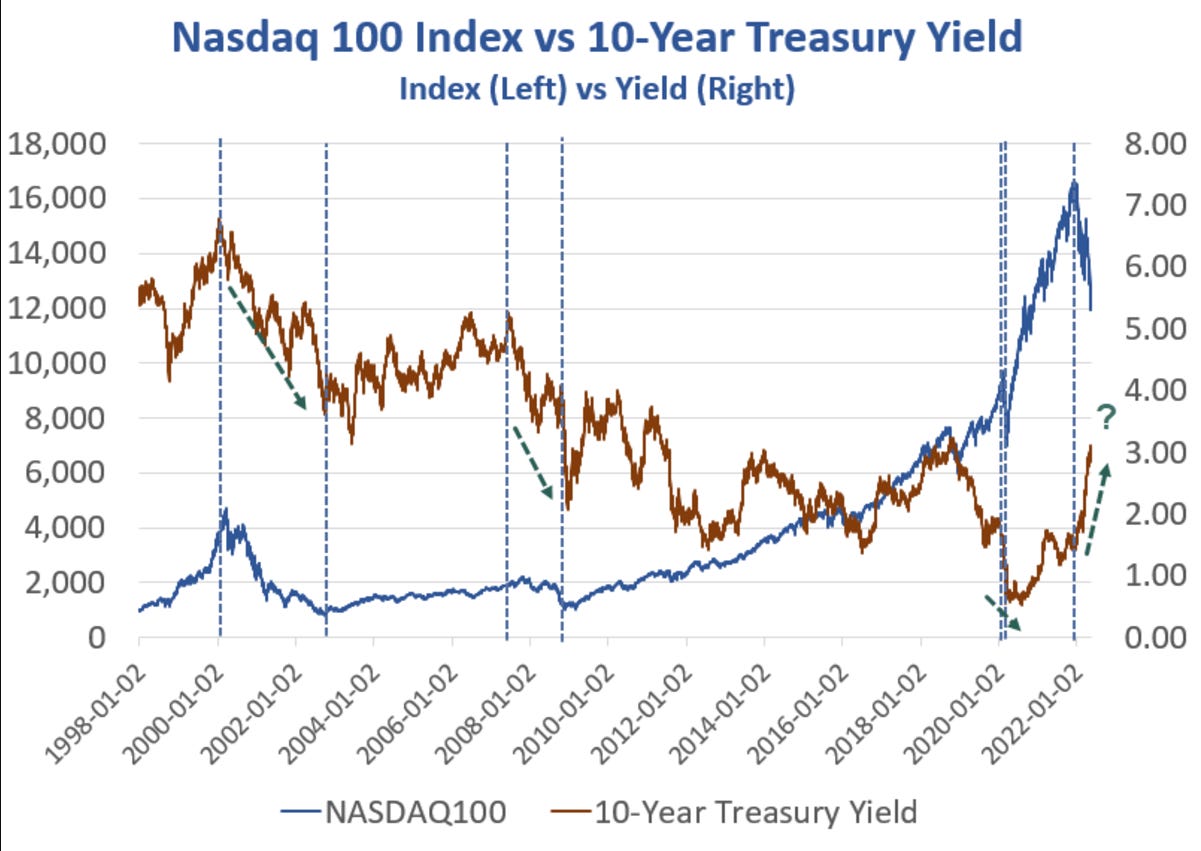
Profitless tech’s volatility: As the Federal Reserve and other central banks around the world raised interest rates, yields increased across various financial markets. The NASDAQ and the 10-year yield show a clear relationship: when yields rose sharply, the NASDAQ fell significantly, demonstrating a stronger negative correlation between the two.
Pic: Nasdaq 100 vs. 10-year treasury (Data: Bloomberg)
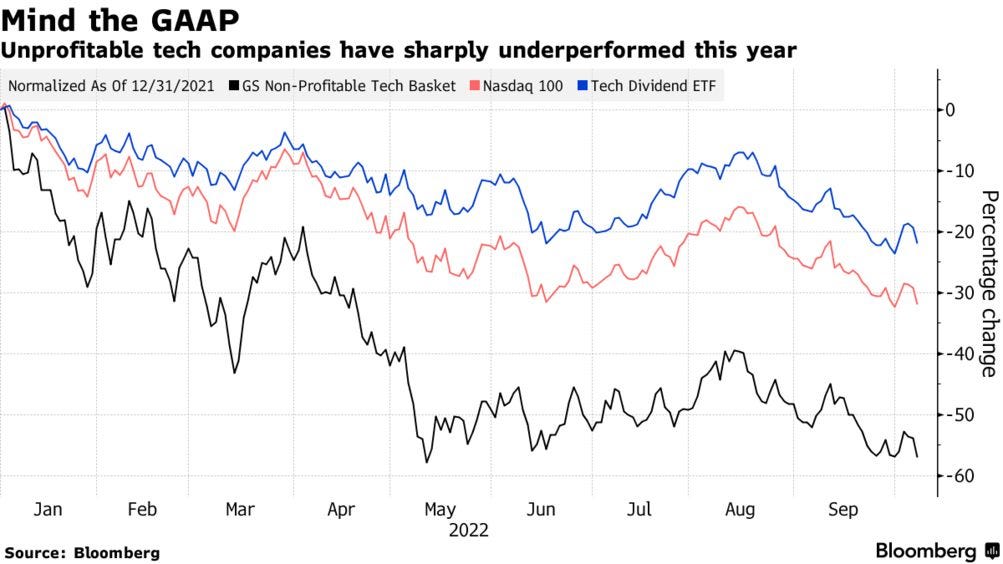
Pic: Unprofitable tech (data: Bloombarg)
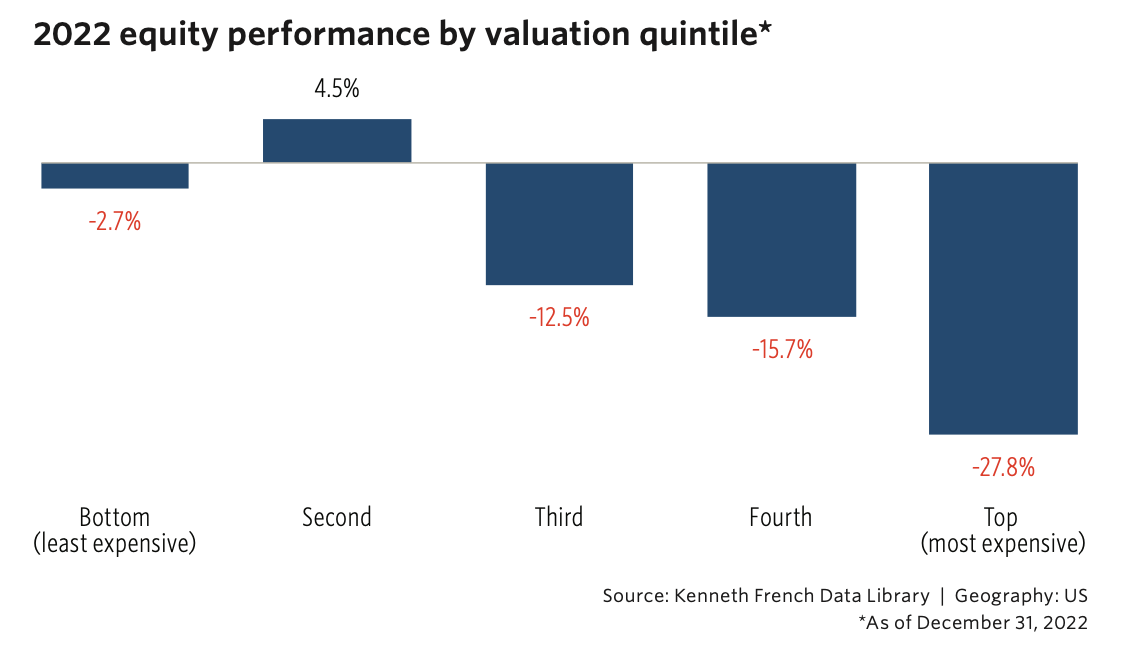
Pic: Equity performance in 2022 (Data: Kenneth French Data Library)
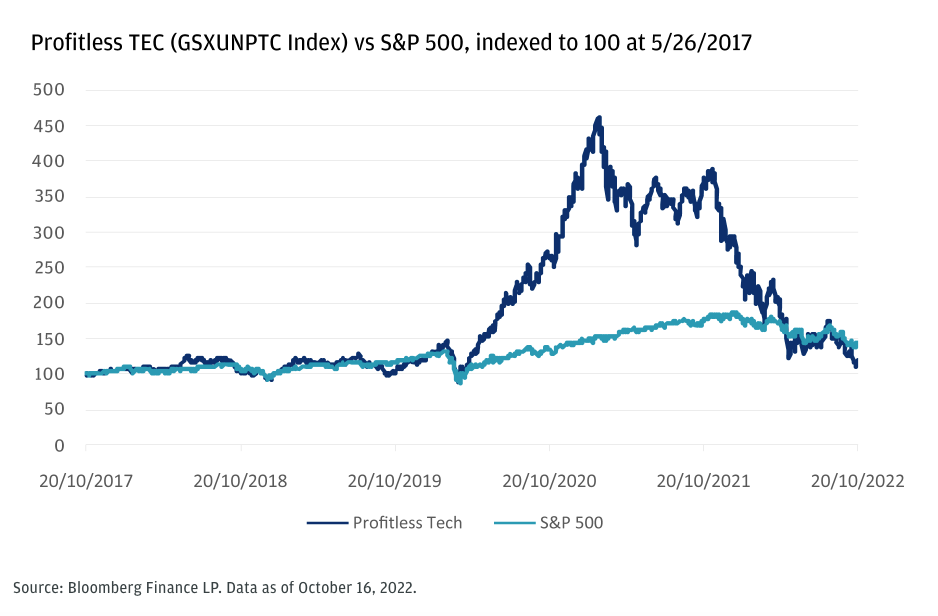
Bottom line: Tech stocks were hit hard during the declines, with the most overvalued and unprofitable stocks dropping the most. This is because these stocks have future cash flows that are further out, making them more sensitive to changes in interest rates. As rates increased, the discount rate in financial calculations also increased, which in turn lowered the valuations of these stocks. This initial phase of the stock selloff, particularly among tech companies, was mainly due to an increasing discount rate. As the pandemic ended, the increased discount rate contributed to the bursting of the tech bubble 2020/21.
Pic: Proftless TEC vs. S&P 500 (Data: Bloomberg)
Ok, that’s it for today. We’ll back next week. Thank you for reading and posting your questions and feedback!
Best,
Max, Tim & Fabian


